The question
Surfers, swimmers and divers in California often ask the same thing before they go out: is this a bad time of year here? Shark incidents are rare, the records are incomplete, and a false alarm costs something different from a missed warning. That makes it a rare-event risk problem, the same shape as predicting battery fires or equipment failures from sparse event data.
SharkGuard answers it for one beach and one date at a time, and shows the history behind the answer.
Data
- Incidents: California Department of Fish and Wildlife (CDFW) Shark Incident Database, 202 confirmed incidents from 1950 to February 2022, with date, location, activity, injury and species. Locations are approximate, so incidents within about 12 km are grouped.
- Shark movement: TOPP (Tagging of Pacific Predators) satellite-tag tracks from the U.S. Animal Telemetry Network, 2002–2013. After filtering to the California coast: 41 white sharks, 14 salmon sharks and 8 common thresher sharks, one position per day.
- Seasonal patterns for species without public tags (leopard, sevengill, smooth hammerhead) come from published research and are drawn as illustrative paths, labeled as such.
Risk score
For a chosen spot and month, the score uses incidents since 2000:
- λ = incidents within 40 km in that month ±1, divided by 3 months and 22.2 years
- score = 100 × √(λ ÷ λmax), where λmax is the highest value at any incident site in any month
- 0–49 green (low), 50–74 yellow (caution), 75–100 red (danger)
The ±1 month window smooths very small counts, and the square root keeps low-but-nonzero places from all reading as zero. The score describes the historical pattern only; the site says plainly that it is not a prediction and does not guarantee safety.
What the data shows
- Incidents cluster from August to October, when water is warmest and the most people are in it.
- Surfers and boarders are involved in about half of incidents since 2000, and more than half caused no injury.
- The real tag tracks match the published seasonal story: white sharks crowd the Farallon Islands from about October to January and then head far offshore, salmon sharks come south in winter and spring, and threshers are off California mostly from September to April.
Design
- Planner first: location and date are the only inputs. Everything updates as you change them, with a score memo, a month-by-month strip and a list of nearby incidents.
- Map: NASA shaded relief and seafloor, light and dark themes, filters for activity and injury. Rings show incidents per stretch of coast for the selected season; zooming in reveals each incident with injury (color), activity (icon) and shark group (badge).
- Motion: tagged sharks replay where they actually were in the chosen month, trailing dashed paths in their group color.
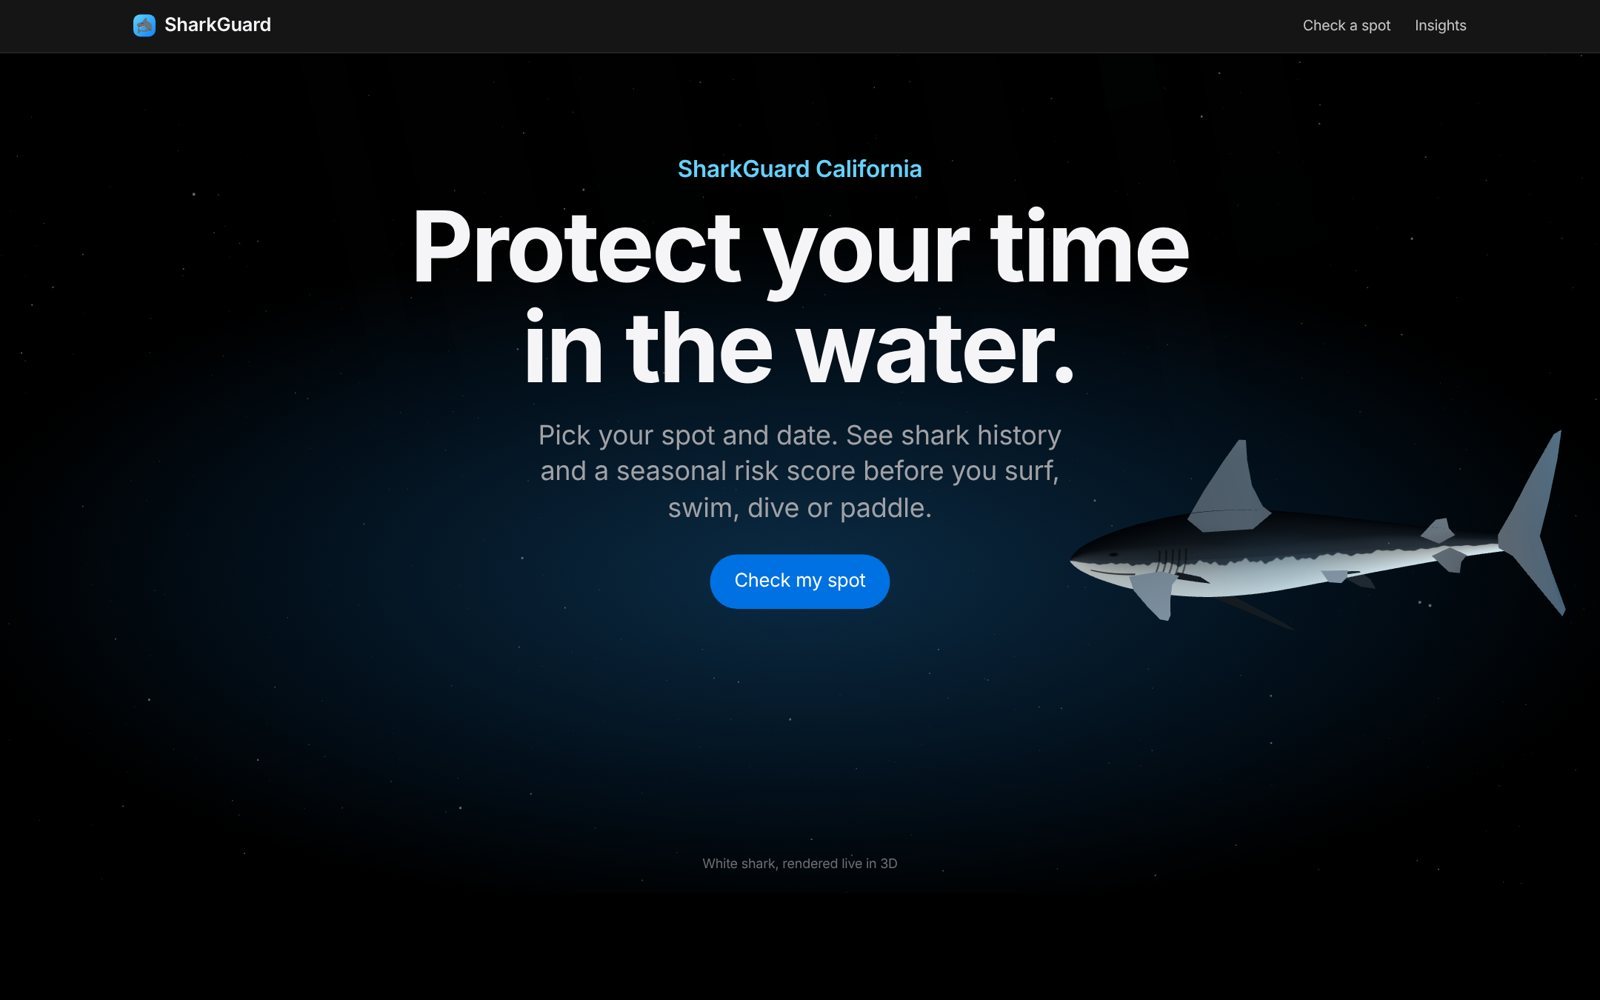
- 3D opener: a white shark modeled procedurally in three.js and animated in a GPU shader.
Stack
Python and pandas for data preparation, D3 for the map, Apache ECharts for charts, three.js for 3D, and GitHub Pages for hosting. The whole site is static, so it costs nothing to run.
Next
- Calibrate the score against held-out years, the way you would validate any rare-event model
- Add incidents after February 2022 and water temperature from NOAA
- Package it as a mobile app